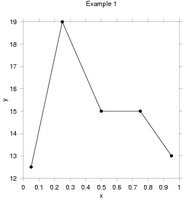
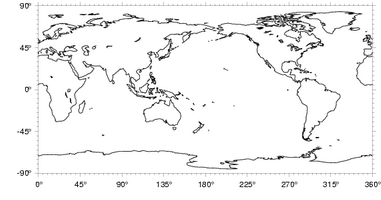
 Also see full-sized graph
and the Gri
code
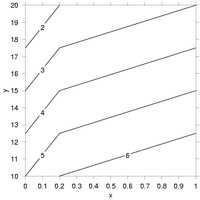
Also see full-sized graph
and the Gri
code
 Also see full-sized graph
and the Gri
code
Also see full-sized graph
and the Gri
code
 Also see full-sized graph
and the Gri
code
Also see full-sized graph
and the Gri
code
 Also see full-sized graph
and the Gri
code
Also see full-sized graph
and the Gri
code
 Also see full-sized graph
and the Gri
code
Also see full-sized graph
and the Gri
code
 Also see full-sized graph
and the Gri
code
Also see full-sized graph
and the Gri
code
 Also see full-sized graph
and the Gri
code
Also see full-sized graph
and the Gri
code
 Also see the Gri
code
Also see the Gri
code
 Also see the Gri
code
Also see the Gri
code
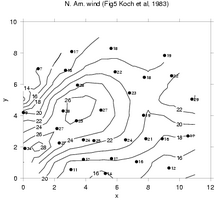
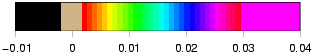
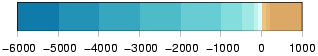
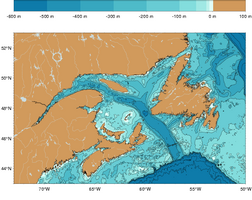
Note: since images are stored in an 8-bit value in Gri, GEBCO color-coding can match inappropriately to contours, in regions of steep topography. The range of depths is 5500m (-5000m to 500m), and with 8 bits this yields a resolution limit of dz=21.5m. Now consider the color transition near 100m depth. The image colours are quantized, with 4*dz being 85.9375 and 5*dz being 107.4m, so that the 100m contour cannot possibly run along the colour transition. This is not a problem if the scale of the chart is large (e.g. the scale of the North Atlantic Ocean), but problems may arise in maps of the continental shelf break. In that case, it's best to modify the image range appropriately, so that it matches the depths more precisely. Thus, you might realize that no depths above 50m were present, or below 2000m; therefore the image range would be 2500m, and the resolution drops to dz=12m, approximately.
 Also see full-sized graph
and the Gri
code
Also see full-sized graph
and the Gri
code
This example uses the proj unix command. proj is a general and very powerful standalone package, not a standard part of unix. It is available from United States Geological Service at ftp://kai.er.usgs.gov/pub/PROJ.4/PROJ.4.3.3.tar.gz and is also at the much more extensive site http://www.remotesensing.org/proj .
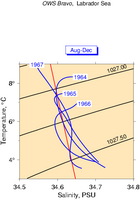
 Also see full-sized graph,
the Gri
code,
and the palette
RGB file.
Also see full-sized graph,
the Gri
code,
and the palette
RGB file.
To get a palette that runs vertically, as opposed to horizontally, do as in this snippet of Gri code.
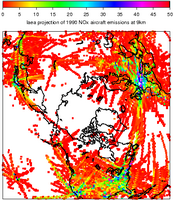
 Also see full-sized graph.
The code is not available at this time.
Also see full-sized graph.
The code is not available at this time.
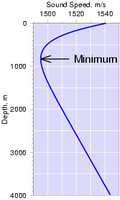
 Also see full-sized graph
and the Gri
code.
Also see full-sized graph
and the Gri
code.
 Also see full-sized graph
and the Gri
code.
Also see full-sized graph
and the Gri
code.
This is a remake of example 14 above, but instead of using a gradual image colorscale, we use a stepped one modified from example 10.
 Also see full-sized graph
and the Gri
code.
Also see full-sized graph
and the Gri
code.